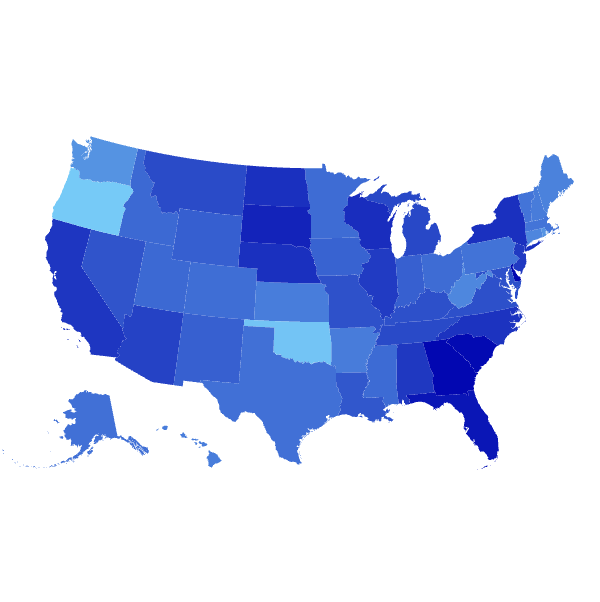
7 Days After One Election, Another Begins
Nov 15, 2022
Scrollytelling
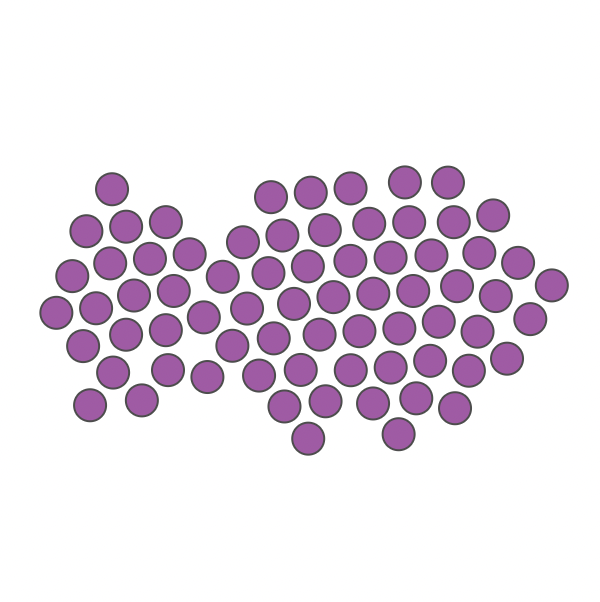
US Happiness Report
Results From A 5,000 Person National Survey On Happiness
Nov 14, 2022
Survey analysis
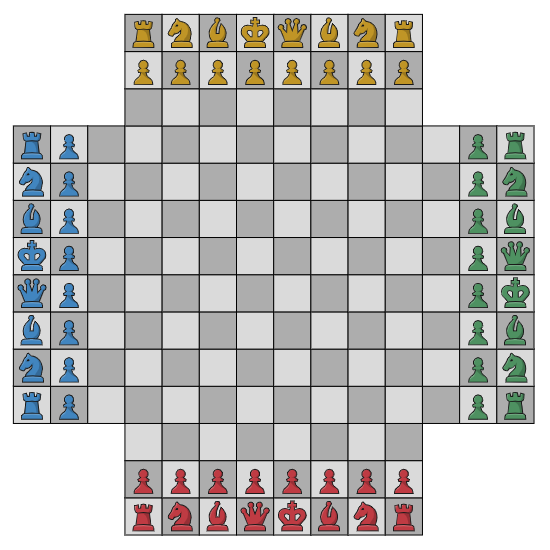
4-Player Chess In Five Charts
Feb 4, 2021
Web scraping
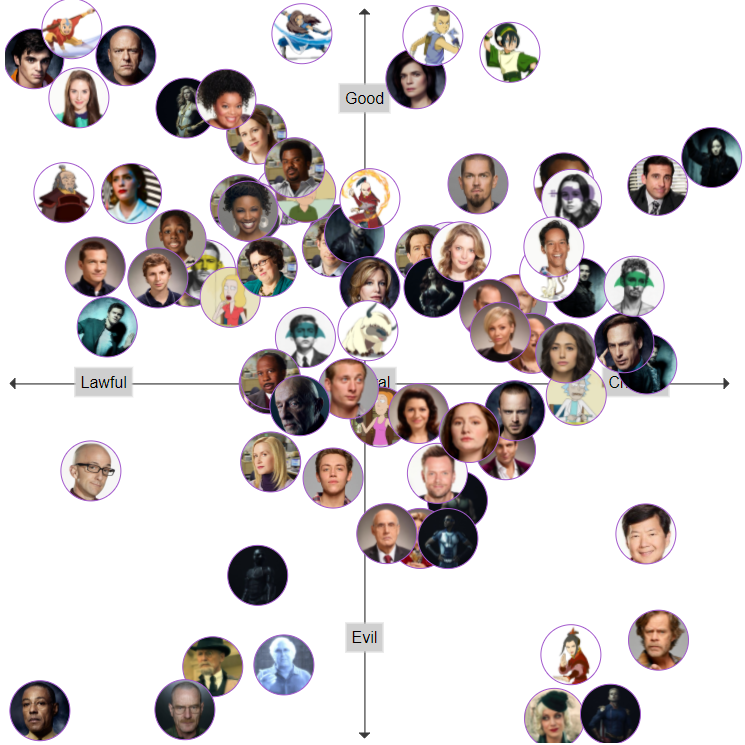
TV Characters Alignment Chart
Mapping How Evil, Good, Chaotic, and Lawful TV Characters Are
Nov 30, 2020
Database
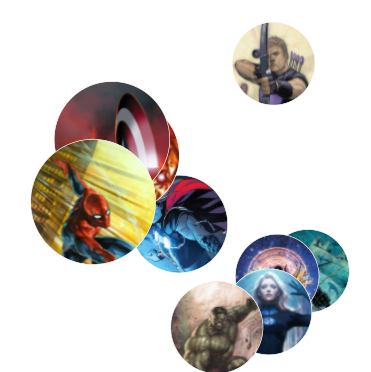
Marvel Characters Similarity Map
Arranged Based On Shared Comic Book Appearances
Sep 30, 2020
Machine learning
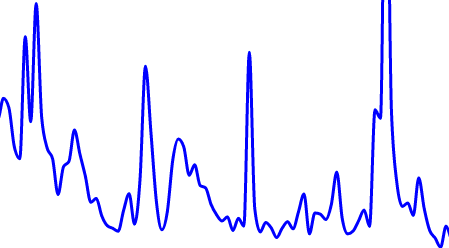
Animated Running Heatmaps
Visualizing 237 Runs Across Two Years
August 12, 2020
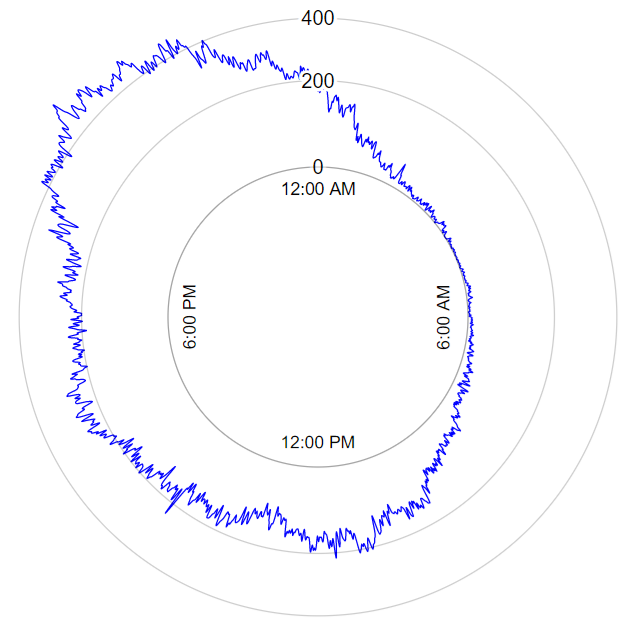
The Timing Of My Messages
An Animated Radial Chart Comparing Two Life Chapters
July 20, 2020
The Three Types Of Economists
Using Machine Learning To Cluster Like-Minded Economists
June 10, 2020
Machine learning
300,000 Tinder Swipes In One Chart
Users End Up Talking To Less Than 1% Of The Profiles They Swipe On
May 6, 2020
Survey analysis
How COVID-19 Could Have Spread On A College Campus
April 15, 2020
Survey analysis
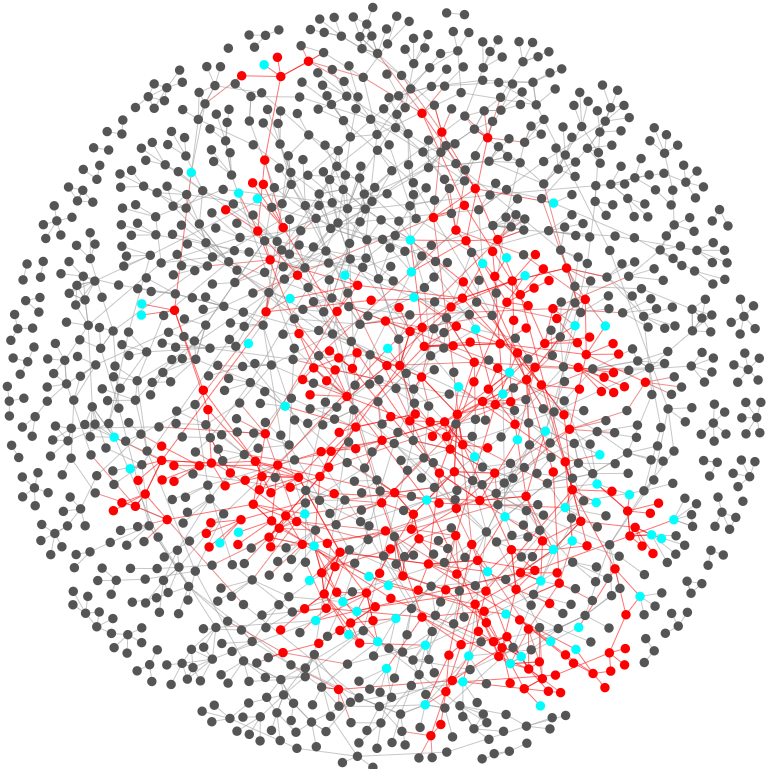
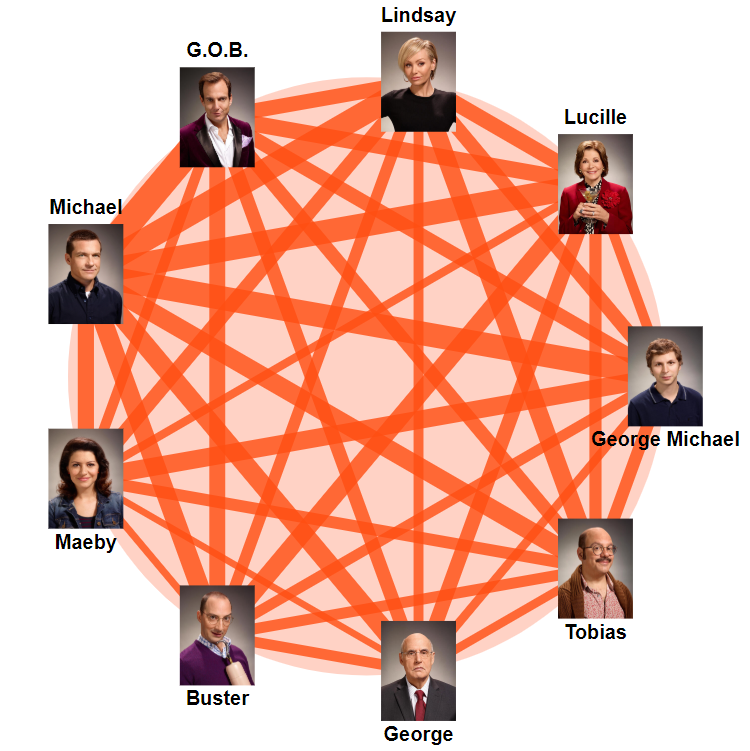
Analyzing The Arrested Development Family Network
Which Bluth Characters Have The Strongest Family Connections?
Mar 6, 2020
Web scraping
The Best Debate Drinking Game Rules, According To Data Science
Feb 3, 2020
Machine learning
74 Democratic Primary Predictions In One Chart
Mapping Each Candidate's Predicted Drop Out Position
Jan 15, 2020
Survey analysis
Who's Winning The Wikipedia Views Race?
Tracking Daily Views Of 2020 Democratic Candidates
Sep 26, 2019
API
The Colors Behind 4,200 Greeting Cards
How Hallmark Cards Differ Based On The Audience
Sep 15, 2019
Web scraping
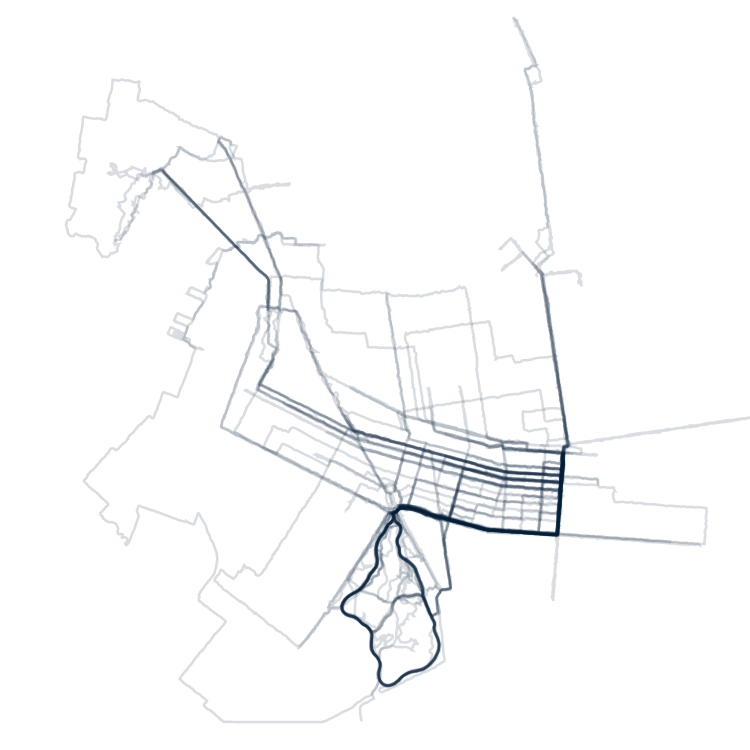
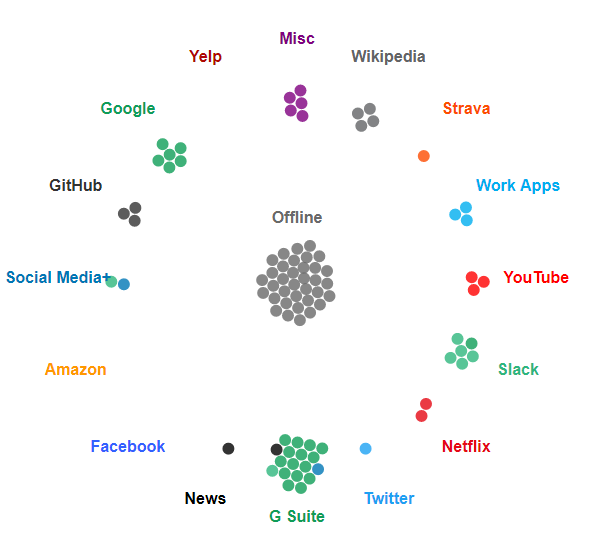
90 Days Of My Internet History In One Graph
Where On The Web I Spend Each Part Of The Day
June 4, 2019
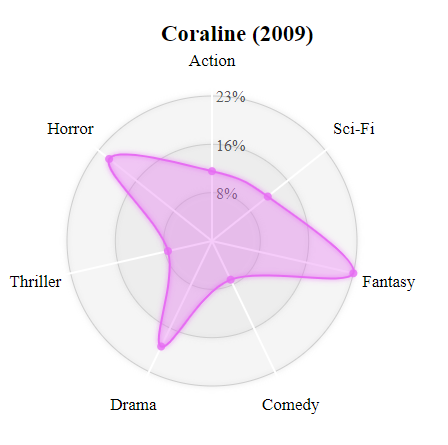
Measuring Film Genres
Is It Possible To Quantify How 'Action' A Film Is?
Jan 28, 2019
Web scraping